Course Content


Why Graphical Facilitation?
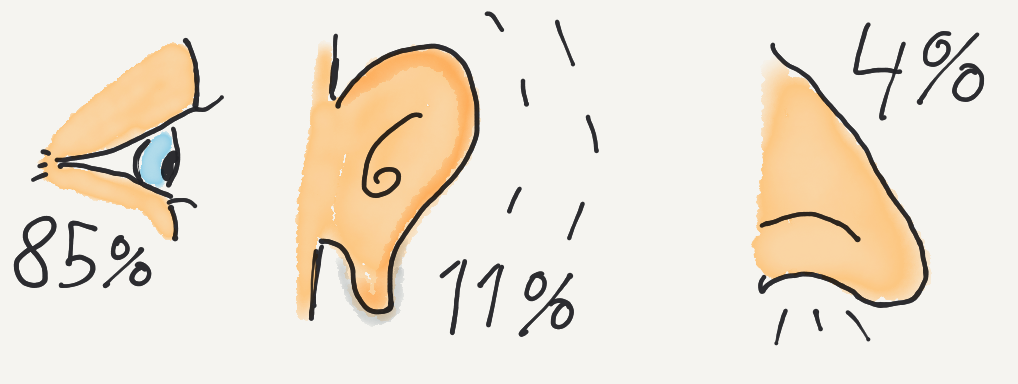
According to research made by Ole Lauridsen, a professor at Aarhus University, human beings who have no seeing or hearing impairments receive 85% of their information through their eyes. 11% is received through their ears and only 4% is received through other senses.
The value of visualisation, of course, also applies to PowerPoint presentations. However, there is a strength in creating visuals on the spot in front of your audience. Firstly, PowerPoint presentations are defined and linear, which means that you must be able to anticipate how your presentation will flow. This may work well as long as you do not invite the audience to engage with you. Once you do, this defined approach may not work, as you may have to change direction or take a detour. Secondly, visuals created in the moment gives the participants a sense of inclusion and co-creation of content with you. This gives them a feeling of ownership, and they learn better. Thirdly, by producing your visuals on the go and hanging them up in the training room, you have a kind of 3D workbook. As you progress through the training and workshop, you have the ability to easily refer back to previous flip-charts. You can tie the knot simply by walking back to previous flip-charts and pointing to them. This is a strong way of using the learning loop.
When creating graphical visualisations, it is important to have the right tools. This we will briefly address this next.
0 comments
Leave a comment
Please log in or register to post a comment